How Reynolds changed the trajectory of their aisle
Using Scintilla to identify and help reverse a sales decline

“Scintilla told us the starting point for the mod and the direction it flowed, so we could make a recommendation to align aisle segments with Action Alley in each store.”
When performance in the Tableware modular began declining, the Category team at Reynolds worked with the Walmart merchant to diagnose the issue and plan a fix. The team dove in to tools across the Scintilla ecosystem to understand changes in the market, the category, and customer needs.
See how Reynolds used insights into shopper behaviors to develop recommendations that repositioned the aisle, demonstrating how data-led aisle optimization can drive incremental growth.
The opportunity: Strategizing a quick fix for declining sales
The Reynolds team noticed that performance in the Disposable Tabletop category was declining. There were lots of possible explanations for different segments of the category, ranging from regulatory shifts to legacy business decisions. In-store factors like segment location or shifts in shopper behaviors could also have played a part.
With so many possibilities in play, Reynolds teamed up with their Walmart merchant to find and fix the problem.
The approach: Analyzing disposable tabletop category customer trends and insights
The Reynolds team started by improving their understanding of Disposable Tabletop shoppers so they could ensure that the modular was optimized for customers’ needs. They used tools from across the Scintilla ecosystem, adding syndicated third-party data to further illustrate the competitive landscape, product gaps, and customer traits.
With Shopper Behavior, the team dug into customer demographics to examine which shoppers favored different segments of the category, plus how they cross-shopped or substituted products. The results provided a clear picture of how customers’ baskets overlapped segments.
Then Reynolds used Customer Perception to add color to their analysis with input sourced directly from customers. The team surveyed shoppers about the kinds of occasions that brought them to each segment in the category and the types of trips they tended to make, along with any assortment gaps or pain points they encountered.
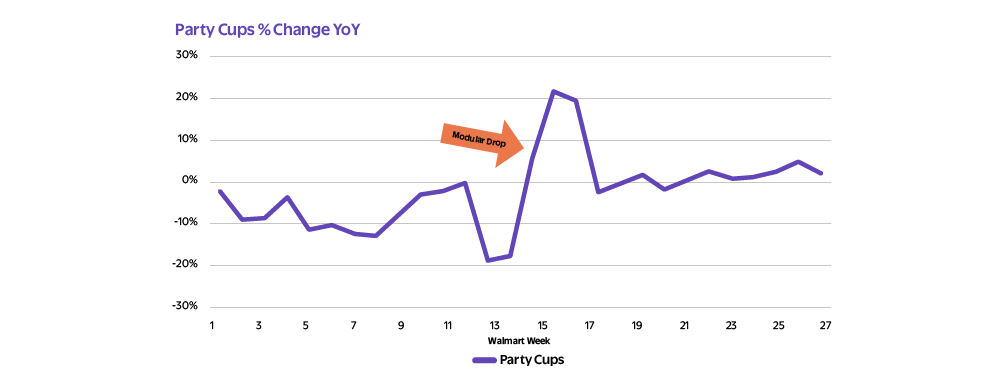
Next, Reynolds used Channel Performance to take a higher-level view of performance in the category. They measured the velocity and progression of items by segment, breaking them down by modular and by store section identifiers. This methodical approach led them to one clear contributor to the decline: Party Cups was underperforming every other segment in the category, with noticeable year-over-year declines each year since COVID.
Rethinking the modular flow
Based on their insights into shopper behaviors and category performance, Reynolds believed that optimizing the modular flow could help accelerate sales. They proposed a strategy to align the modular with customer basket overlap trends, placing each segment next to the segments most often shopped alongside it. Ideally, that would make it easier for customers to find their products, resulting in basket growth.
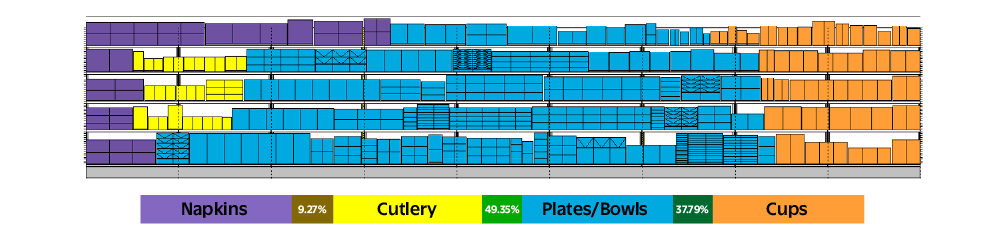
Knowing that layout varies between stores, Reynolds set out to find a way to tailor each modular to its location. While that had historically been a difficult proposition, they were able to use Scintilla modular metrics to triangulate the direction of each aisle’s flow from Action Alley.
They recommended adjusting the modular store-by-store to place high-priority segments like Party Cups closest to Action Alley, spurring incremental growth.
The results: Reversing a decline into growth
The new modular flow Reynolds proposed was a multidimensional success. It led to growth at every level: for Party Cups, for basket overlap within the category, and for overall category performance.