



Is Energy over-assorted or under-spaced?
How Red Bull used shopper insights to rethink energy drink assortment and space

Scintilla helps us to peek around the corner: to see how customers shop the category today and predict how they’ll shop it tomorrow.
Red Bull Canada faced a classic retail question: Was the Energy category over-assorted—or simply under-spaced? With Red Bull’s sales growing five times faster than space allocated to the category, the beverage brand turned to Scintilla to see if asking their merchant to pare down the assortment might be the answer
The opportunity: Simplify the shelf or make more room?
With limited shelf space, Red Bull needed to determine whether different can sizes were competing for the same customers or serving distinct needs. In particular, they looked at the 355mL format to see if it was truly incremental or whether shoppers viewed sizes as interchangeable.
Understanding the role of all three of their formats would help the beverage company determine whether reducing assortment was the right move.
The approach: Rethinking space around productivity
Understand the role of each pack size
Using Shopper Behavior to dig into product group performance by price sensitivity, shopper missions, and basket assortment, Red Bull compared the roles of their 250 mL, 355 mL, and 473 mL sized cans.
The analysis showed that each served a different purpose. Pack sizes varied by shopper mission, price sensitivity, and source of volume. For example, one in four 250 mL buyers were new to the category, while the 473 mL format resonated with heavy users who had a 21% larger associated basket size than other shoppers.
In other words, what looked like duplication on the shelf was actually segmentation.
Shopper Behavior’s Assortment Deep Dive helped Red Bull model what could happen if individual can sizes were removed. Even after accounting for shoppers switching to other sizes, packs, or brands, the analysis projected category declines ranging from 2.4% to 3.7%.
That risk took on greater significance since the Energy category had a 16% three-year compound annual growth rate (CAGR). So instead of simplifying the assortment, Red Bull concluded that the category had outgrown its existing space.
Find opportunities to make more room
With the analysis pointing toward assortment expansion rather than reduction, Red Bull turned its attention to shelf space.
They mapped the existing Energy footprint and examined adjacent categories to identify opportunities for smarter space allocation. The analysis showed that 66% of stores had energy sets of four feet or less, while Energy was more than twice as productive as frequent adjacent categories like Iced Tea.
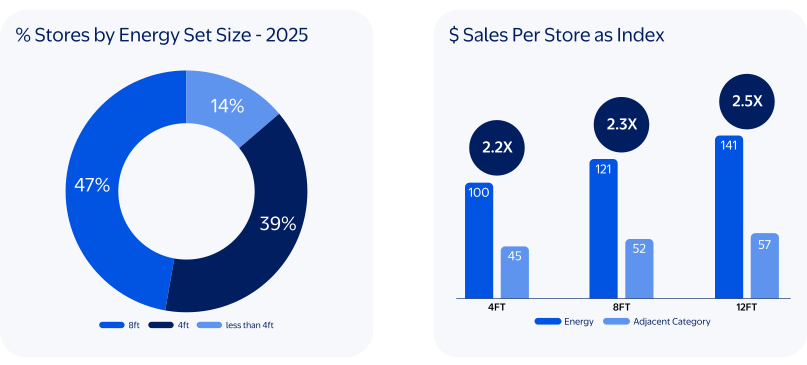
The brand then modeled what would happen if four feet shifted from that adjacent category to Energy. Even after accounting for the adjacent category's projected decline, the scenarios showed a net favorable effect of about 14 points across the broader beverage business.
Working with their merchant, Red Bull put the hypothesis to the test in a store where the adjacent category occupied three times the space of energy while generating about half the dollars. The store kept the total 16-foot footprint unchanged but divided it evenly between the two categories.
The test exceeded expectations, delivering 12.3% incremental growth against a projection of approximately 10%.
The results: Turning a store test into a scalable strategy
With a successful test behind them, Red Bull worked to identify where the approach could deliver similar results
Starting with 406 stores, Red Bull narrowed the opportunity based on physical and financial criteria. Stores needed the right energy modular setup, an adjacent category on the same aisle and side, and enough projected growth to justify the operational change.
That process ultimately identified 25 stores where reallocating space offered the strongest opportunity. Those stores delivered 7% incremental revenue growth during the test period.
The exercise demonstrated a broader principle: Space allocation needs to evolve as categories and customer behavior evolve. By combining shopper behavior with assortment and store-level productivity data, Red Bull moved beyond a one-size-fits-all approach to create a more scalable architecture for growth.
